Extract population data for Brighton & Hove from Worldpop
Contents
Extract population data for Brighton & Hove from Worldpop#
What is this?
This notebook demonstrates how to process WorldPop population data. Here, we will convert the data from a 100 meter raster grid into a Point layer in which the centroid of the raster cell is used as a location for the point.
Download the data#
Download the raster dataset for UK from: https://hub.worldpop.org/geodata/summary?id=49903
import xarray as xr
import rioxarray as rx
import geopandas as gpd
from shapely.geometry import box
# Read raster data (i.e. the one downloaded from Worldpop hub) - Notice you need to download the data for this to work!
fp = "data/Brighton/gbr_ppp_2020_constrained.tif"
data = rx.open_rasterio(fp).squeeze("band", drop=True).to_dataset(name="population")
# Data extent for Brighton
bounds = (-0.49975, 50.73, 0.3469234, 50.98)
# Create a GeoDataFrame
gdf = gpd.GeoDataFrame(geometry=[box(*bounds)], crs="EPSG:4326")
gdf.explore()
Make this Notebook Trusted to load map: File -> Trust Notebook
# Clip the raster
data = data.rio.clip(gdf.geometry.values, gdf.crs, drop=True)
# Check what is the min value
data["population"].min()
<xarray.DataArray 'population' ()>
array(-99999., dtype=float32)
Coordinates:
spatial_ref int64 0# Keep only values that are higher than 0
data["population"] = data["population"].where(data["population"] >=0)
# Plot the population
data["population"].plot(cmap="Reds")
<matplotlib.collections.QuadMesh at 0x7f690b7e6740>

# Convert grid to points (a centroid of the cell is used as the location for the point)
df = data.to_dataframe().reset_index().drop(["spatial_ref"], axis=1)
df.head()
| x | y | population | |
|---|---|---|---|
| 0 | -0.499167 | 50.980000 | NaN |
| 1 | -0.499167 | 50.979167 | NaN |
| 2 | -0.499167 | 50.978333 | NaN |
| 3 | -0.499167 | 50.977500 | NaN |
| 4 | -0.499167 | 50.976667 | NaN |
# Create GeoDataFrame out of the points
df["geometry"] = gpd.points_from_xy(df["x"], df["y"])
gdf = gpd.GeoDataFrame(df, crs="epsg:4326")
# Drop points without population
gdf = gdf.loc[gdf["population"]>=0].copy()
gdf.head()
| x | y | population | geometry | |
|---|---|---|---|---|
| 9 | -0.499167 | 50.972500 | 10.112679 | POINT (-0.49917 50.97250) |
| 10 | -0.499167 | 50.971667 | 19.579712 | POINT (-0.49917 50.97167) |
| 11 | -0.499167 | 50.970833 | 12.178864 | POINT (-0.49917 50.97083) |
| 14 | -0.499167 | 50.968333 | 5.552000 | POINT (-0.49917 50.96833) |
| 15 | -0.499167 | 50.967500 | 2.551825 | POINT (-0.49917 50.96750) |
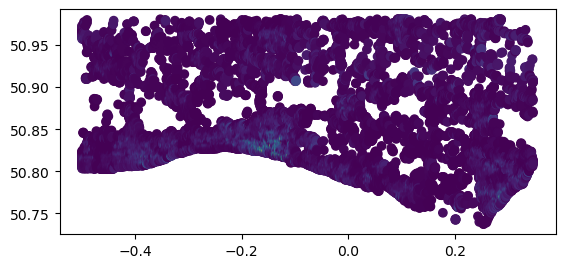
gdf.plot(column="population")
<AxesSubplot: >
# Explore interactively
gdf.cx[-0.3:0.0, 50.8:50.88].explore(column="population")
Make this Notebook Trusted to load map: File -> Trust Notebook
# Add index as id for the point
gdf = gdf.reset_index(drop=True)
gdf["id"] = gdf.index
gdf.head()
| x | y | population | geometry | id | |
|---|---|---|---|---|---|
| 0 | -0.499167 | 50.972500 | 10.112679 | POINT (-0.49917 50.97250) | 0 |
| 1 | -0.499167 | 50.971667 | 19.579712 | POINT (-0.49917 50.97167) | 1 |
| 2 | -0.499167 | 50.970833 | 12.178864 | POINT (-0.49917 50.97083) | 2 |
| 3 | -0.499167 | 50.968333 | 5.552000 | POINT (-0.49917 50.96833) | 3 |
| 4 | -0.499167 | 50.967500 | 2.551825 | POINT (-0.49917 50.96750) | 4 |
# Save data to file
gdf.to_file("data/Brighton/Brighton_pop_points_2020.gpkg", driver="GPKG")